

Mission Accomplished! I genuinely thought I was smiling in both pictures…
Mission Accomplished! I genuinely thought I was smiling in both pictures…

Just another training run…

It’s amazing how quickly 3 months can cruise by…

“We need a new house” says my wife. So I built one! Two in fact!

If you thought I’d run out of space in my house to build more shelves then think again!

I’ve made a good start to my marathon training with a new 10k PB.
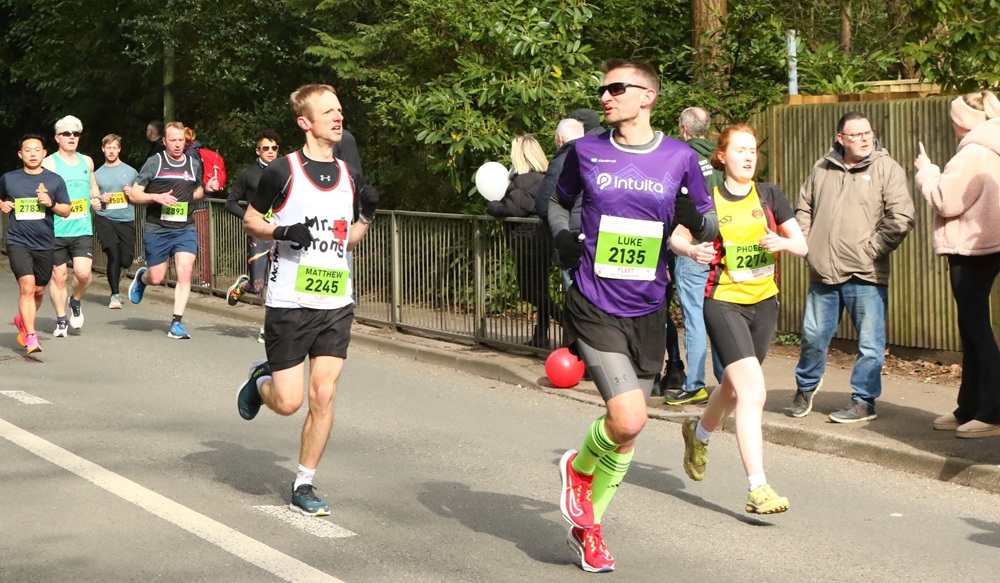
A genuinely enjoyable run.

Run a marathon!

The FIFA World Cup Trophy. Made from over 200 coins. Complete with interactive dashboard.

I’ve made a few items that are designed to be hung on a wall so I decided to create a space to showcase them.